Banguat Introduces Interactive Dashboard to Track GDP Across Guatemala’s Regions
Guatemala launches its Tablero Digital PIB, an interactive dashboard that measures regional and departmental GDP to support data-driven economic policy and investment decisions.

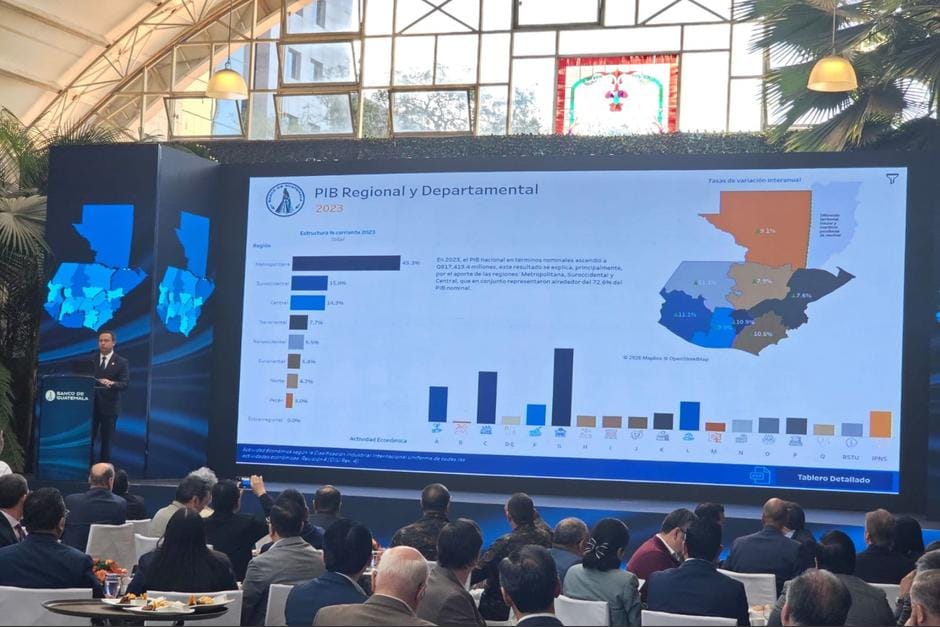
The launch of Guatemala’s new Tablero Digital PIB marks a major step forward in understanding the country’s economic performance through detailed regional and departmental data.
Guatemala launches interactive regional GDP dashboard
The Bank of Guatemala (Banguat) has introduced an Interactive Regional and Departmental Gross Domestic Product Dashboard, a digital tool that expands national economic analysis by incorporating disaggregated data across the country’s eight regions and 22 departments.
During the presentation, Banguat President Álvaro González Ricci emphasized that the platform enables a territorial approach to economic growth.
“This is an interactive visualization dashboard covering the period from 2013 to 2023, offering the country a new way to understand its economy,” he said.
A new lens on territorial economic growth
Con la publicación del #PIBRegionalyDepartamental, Guatemala se posiciona como uno de los doce países de América Latina y el Caribe que cuenta con esta medición, consolidando al #Banguat como un referente en producción de información económica clave para tomadores de decisiones. pic.twitter.com/7sIYqnGzt3
— Banco de Guatemala (@Banguat) January 22, 2026
According to González Ricci, the dashboard shifts how economic performance is analyzed by focusing on how growth is generated in each territory and across every economic activity.
“With this new statistical framework, we can now understand how the economy works in each region and department,” he noted.
The tool provides a more granular view of economic dynamics, strengthening both public and private sector decision-making through more precise and locally grounded data.
What the dashboard measures and enables
The digital platform enhances national economic analysis by enabling users to:
- Quantify each region’s and department’s contribution to national GDP.
- Identify dominant economic activities and local productive dynamics.
- Support public policy formulation in areas such as education, health, infrastructure, and investment, based on regional specificities.
- Analyze regional and departmental economic performance from 2013 onward through interactive panels, charts, heat maps, time series, and GDP per capita indicators.
“This progress is not only technical; it is deeply strategic because it strengthens the State’s capacity to design fairer, more efficient, and more context-aware public policies,” González Ricci stated.
Measuring 17 economic activities at the local level
The new dashboard captures data across 17 economic activities for each of Guatemala’s 22 departments. It also enables the evaluation of how projects and public policies impact these sectors, now with a departmental focus.
Banguat’s reports highlight internal sector growth, including sugar, textiles, and tourism, alongside Guatemala’s macroeconomic stability, supported by recent risk ratings of BB from S&P and Fitch.
The information will be available on Banguat’s official website as well as through the national GT indicators dashboard.

Guatemala joins regional leaders in subnational GDP measurement
With this initiative, Guatemala positions itself among the 12 countries in Latin America and the Caribbean that measure GDP (Gross Domestic Product) at both regional and departmental levels.
This development strengthens Banguat’s role as a reference institution in producing key economic data for national decision-making and for international presentation through Guatemala’s consular network.
The implementation of this digital tool reaffirms Banguat’s commitment to producing and disseminating timely, transparent, and comparable economic statistics that support policymaking, academic research, and a deeper understanding of territorial economic development.